Building Real-time Analytics Dashboards with Modern Web Technologies
May 16, 2025 · By Engine9Labs Admin

Building Real-time Analytics Dashboards with Modern Web Technologies
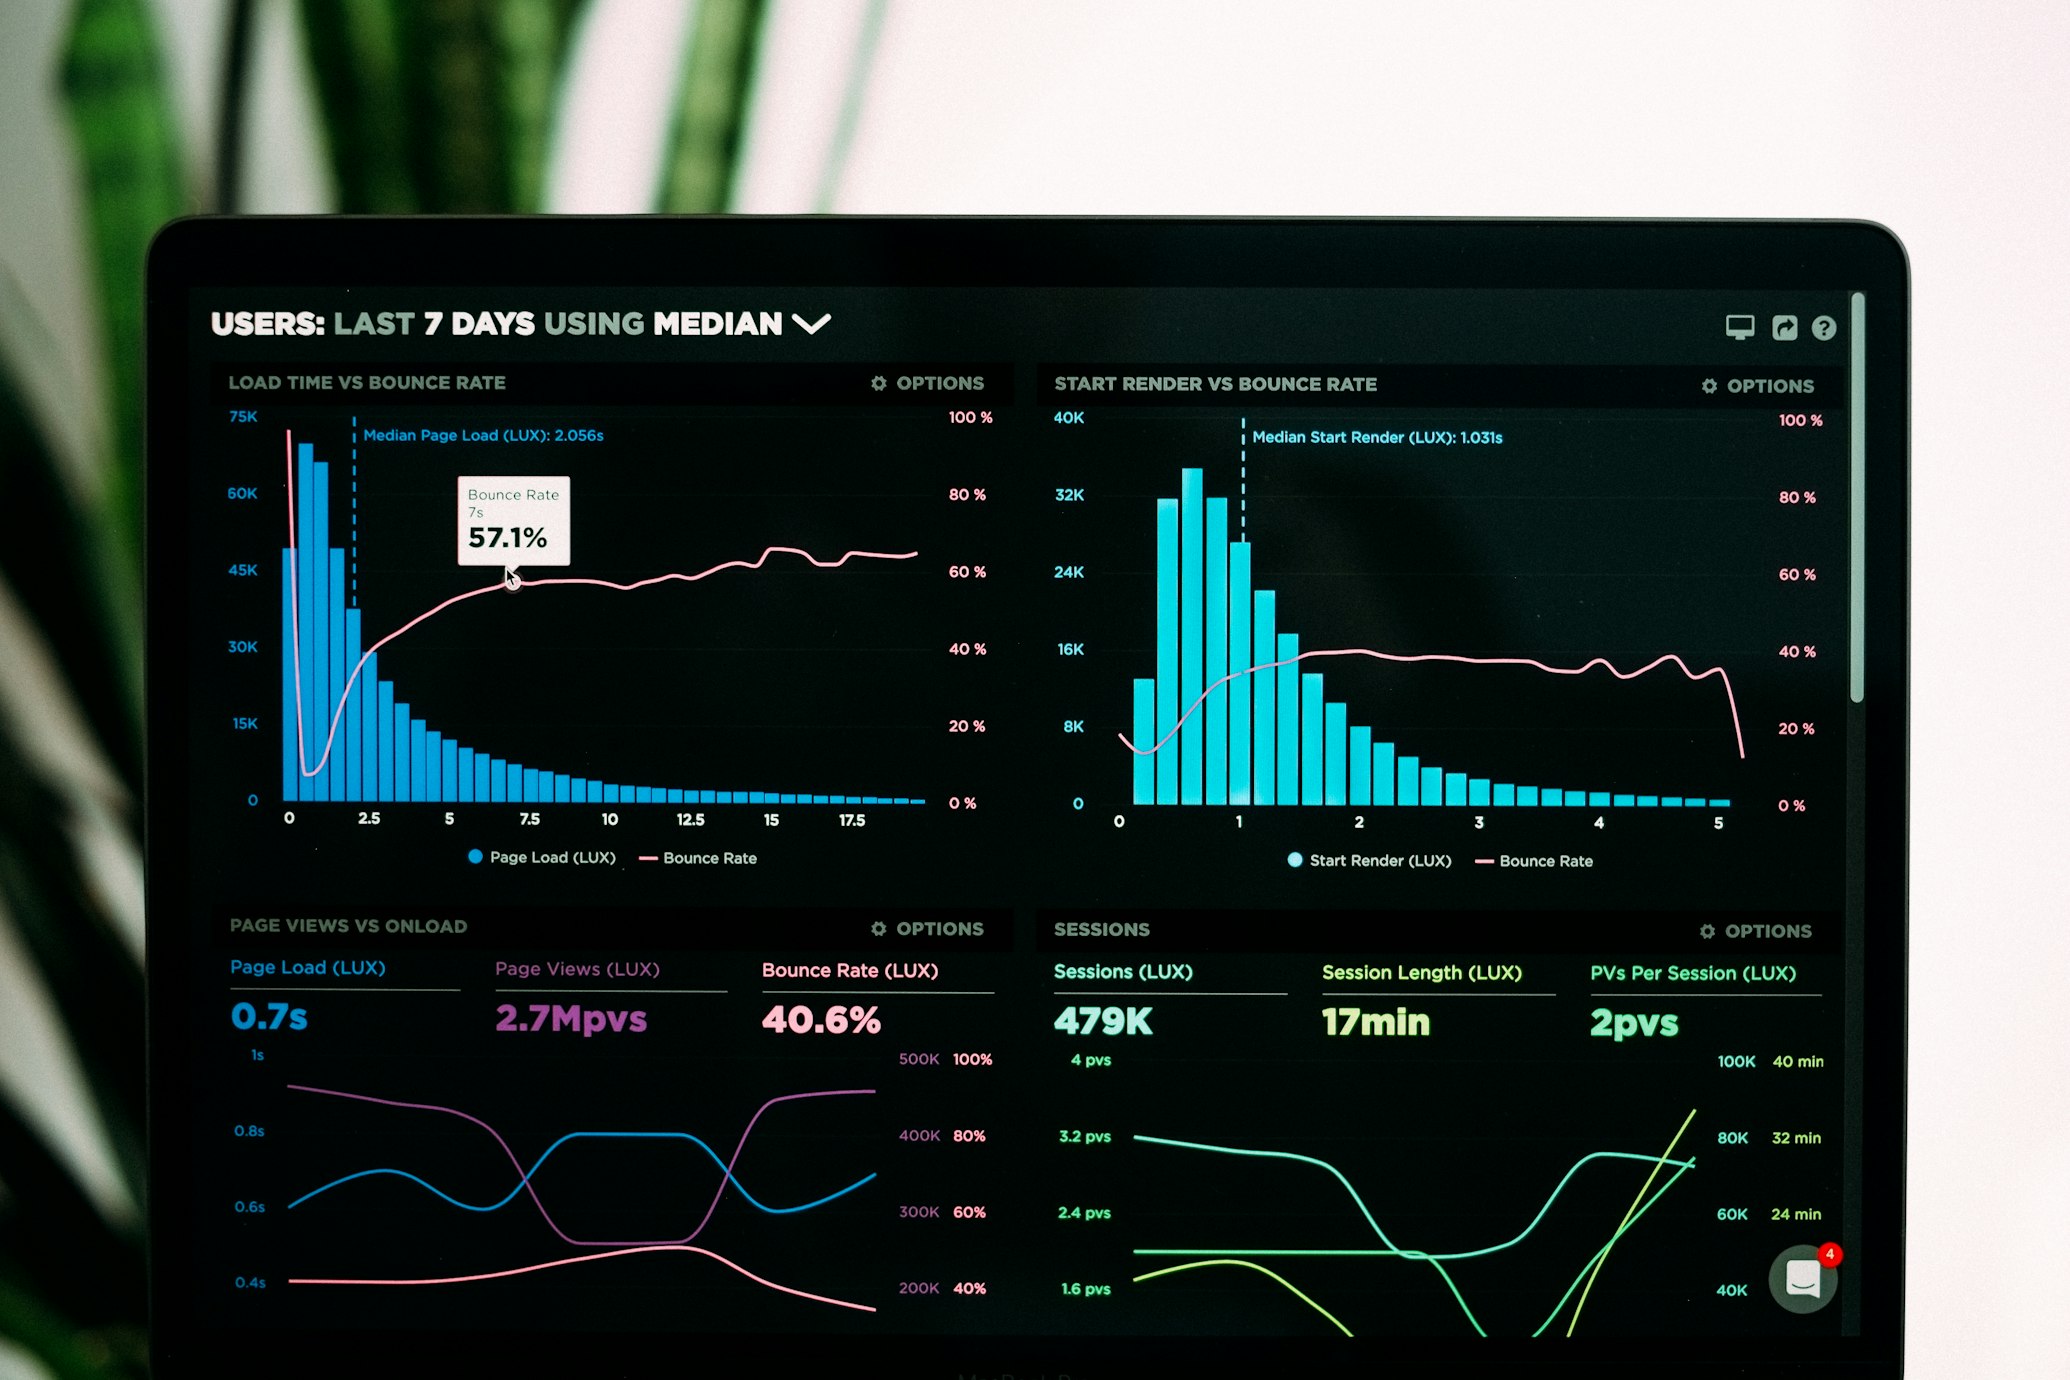
Real-time analytics dashboards are essential for modern businesses to make data-driven decisions quickly. With the right technology stack, you can create responsive, interactive dashboards that provide instant insights.
The Modern Dashboard Stack
Frontend Technologies
- SvelteKit - For reactive, high-performance user interfaces
- D3.js - For custom data visualizations
- Chart.js - For standard chart types
- WebSocket - For real-time data updates
Backend Technologies
- Node.js - Fast, event-driven server
- PostgreSQL - Reliable data storage with real-time features
- Redis - Caching and pub/sub for real-time updates
- GraphQL - Efficient data fetching
Key Features of Effective Dashboards
Real-time Updates
Implement WebSocket connections for live data streaming:
// Client-side WebSocket connection
const ws = new WebSocket('ws://localhost:3000/analytics');

ws.onmessage = (event) => {
  const data = JSON.parse(event.data);
  updateDashboard(data);
};
Interactive Visualizations
Create engaging charts that users can explore:
import { scaleLinear, scaleTime } from 'd3-scale';
import { line } from 'd3-shape';

// Create responsive time-series chart
function createTimeSeriesChart(data) {
  const xScale = scaleTime()
    .domain(d3.extent(data, d => d.date))
    .range([0, width]);

  const yScale = scaleLinear()
    .domain(d3.extent(data, d => d.value))
    .range([height, 0]);
}
Performance Optimization
- Data aggregation - Pre-compute summary statistics
- Lazy loading - Load chart data on demand
- Virtual scrolling - Handle large datasets efficiently
- Caching strategies - Cache frequently accessed data
Dashboard Design Principles
Visual Hierarchy
- Use size, color, and position to highlight important metrics
- Group related information together
- Maintain consistent styling throughout
User Experience
- Responsive design for mobile and desktop
- Fast loading times
- Intuitive navigation
- Clear data labeling
Data Accuracy
- Real-time validation
- Error handling and fallbacks
- Data source transparency
- Historical context
Implementation with SvelteKit
Setting up the Project
npm create sveltekit@latest analytics-dashboard
cd analytics-dashboard
npm install d3 socket.io-client chart.js
Creating Reactive Components
<script>
  import { onMount } from 'svelte';
  import { writable } from 'svelte/store';

  const metrics = writable([]);

  onMount(() => {
    // Connect to real-time data stream
    connectToDataStream();
  });
</script>

<div class="dashboard">
  {#each $metrics as metric}
    <MetricCard {metric} />
  {/each}
</div>
Deployment and Scaling
Performance Monitoring
- Track dashboard load times
- Monitor data refresh rates
- Alert on data quality issues
- User engagement analytics
Scalability Considerations
- CDN for static assets
- Database query optimization
- Horizontal scaling strategies
- Caching layers
Real-world Examples
E-commerce Dashboard
- Real-time sales metrics
- Inventory levels
- Customer behavior analytics
- Revenue tracking
DevOps Monitoring
- System health metrics
- Application performance
- Error rates and logs
- Deployment tracking
Best Practices
- Start simple - Begin with core metrics and expand gradually
- Focus on actionability - Only display data that leads to decisions
- Optimize for speed - Fast dashboards encourage usage
- Test with real data - Use production-like datasets during development
- Gather user feedback - Iterate based on actual usage patterns
Conclusion
Building effective real-time analytics dashboards requires careful consideration of both technical implementation and user experience. With modern web technologies like SvelteKit and proper architecture, you can create dashboards that truly empower data-driven decision making.
Engine9Labs specializes in building custom analytics solutions that scale with your business needs.